


How to troubleshoot slow builds quickly?

Slow build times can be a significant drag on development velocity and a source of constant frustration. In today’s fast-paced development environments, waiting minutes, or even hours, for a build to complete is simply unacceptable. Identifying and fixing the root causes of these slowdowns quickly is essential for maintaining productivity and ensuring efficient continuous integration/continuous delivery (CI/CD) pipelines.
Understanding the Problem: Why Builds Slow Down
Before you can fix a slow build, you need to understand why it’s slow. Build times can increase for a multitude of reasons, ranging from simple configuration issues to fundamental architectural challenges. Common culprits include:
- Growing Codebase: As projects scale, more files need to be compiled, linked, or processed.
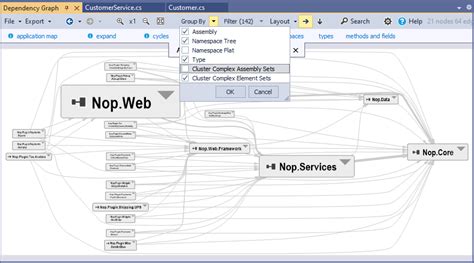
- Complex Dependency Trees: A large number of internal or external dependencies can introduce significant overhead, especially if not managed efficiently.
- Inefficient Build Tools/Configurations: Suboptimal settings, outdated tools, or misconfigured build scripts can severely impede performance.
- Insufficient Resources: The build machine (local or CI/CD agent) might lack the necessary CPU, memory, or I/O bandwidth.
- Lack of Caching: Rebuilding everything from scratch instead of leveraging cached artifacts dramatically increases build times.
First Steps: Diagnosing the Bottleneck
The quickest way to troubleshoot is often to start with the most obvious and easiest-to-measure aspects. Most modern build systems offer profiling or detailed logging capabilities that can pinpoint exactly where time is being spent.
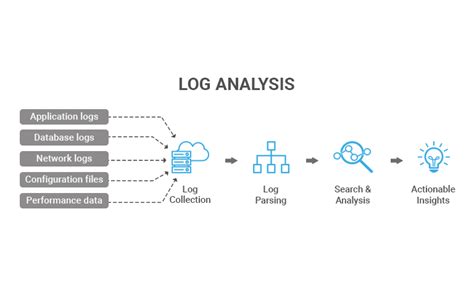
- Analyze Build Logs: Carefully examine the output of your build process. Look for phases that take an unusually long time. Many build tools (e.g., Maven, Gradle, Webpack, MSBuild) provide flags to generate more verbose or timed outputs.
- Use Build Profiling Tools: Specific build systems have built-in profilers (e.g., Gradle Build Scan, Webpack Bundle Analyzer, Visual Studio build profiler). These tools visualize the build process, highlighting critical paths and slowest tasks.
- Time Individual Steps: For shell-based scripts, use the
timecommand to measure the execution duration of critical commands or scripts. This helps isolate slow external tools or sub-processes. - Check Resource Utilization: Monitor CPU, memory, disk I/O, and network usage during a build. Tools like
top,htop, Task Manager, or cloud monitoring dashboards can reveal resource starvation.
Key Areas for Optimization
Dependency Management
Review and prune your project’s dependencies. Are all declared dependencies truly necessary? Can older versions be updated to more efficient ones? For JavaScript projects, consider tools like npm-prune or techniques to tree-shake unused modules. For compiled languages, ensure unnecessary libraries aren’t being linked.
Caching Strategies
Leverage caching at every possible level:
- Local Caching: Most build tools have local caches for downloaded dependencies and compiled artifacts. Ensure these are configured correctly and not frequently invalidated.
- Remote Caching: For CI/CD environments, consider distributed build caches (e.g., Bazel, Gradle Build Cache, Nx) that allow build outputs to be shared across machines and builds.
- Compiler Caches: Tools like
ccachecan significantly speed up C/C++ compilation by caching object files.
Parallelization and Resources
Maximize the utilization of available hardware:
- Parallel Builds: Configure your build system to execute independent tasks in parallel. Most modern build tools support this (e.g.,
make -j, Gradle’s parallel execution, Webpack’s thread-loader). - Increase Resources: If profiling points to CPU or I/O bottlenecks, consider upgrading your build machine’s hardware or allocating more powerful CI/CD agents.
- Distributed Builds: For very large projects, distributed build systems can offload compilation tasks to a cluster of machines.
Advanced Techniques and Continuous Improvement
For persistent or complex slow build issues, consider more advanced strategies and a continuous improvement mindset:
- Incremental Builds: Ensure your build system only recompiles what has changed, rather than rebuilding everything. This often requires careful configuration of build rules and file watchers.
- Remote Execution: Offload build steps to powerful remote servers, even if your local machine is less powerful, to leverage more significant compute resources.
- Dedicated Build Servers: If using a shared CI/CD environment, dedicated or isolated build agents can prevent resource contention.
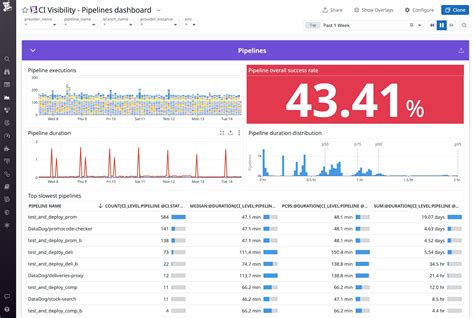
- Regular Monitoring: Integrate build time tracking into your CI/CD pipeline. Monitor trends and set alerts for when build times exceed acceptable thresholds. This helps catch regressions early.
- Code Structure Refactoring: In some cases, slow builds are symptoms of a monolithic or tightly coupled codebase. Modularizing your application can allow for more targeted and faster builds of individual components.
Conclusion
Troubleshooting slow builds requires a systematic approach: diagnose the problem, identify the bottlenecks, and then apply targeted solutions. By leveraging build profiling tools, optimizing dependencies and caching, maximizing parallelization, and continuously monitoring your build times, you can significantly reduce build durations and reclaim valuable developer time. A fast build process is a cornerstone of an agile and efficient development workflow, directly contributing to higher productivity and quicker time-to-market.